Legacy · Thermal validation
UHE São Manoel piers
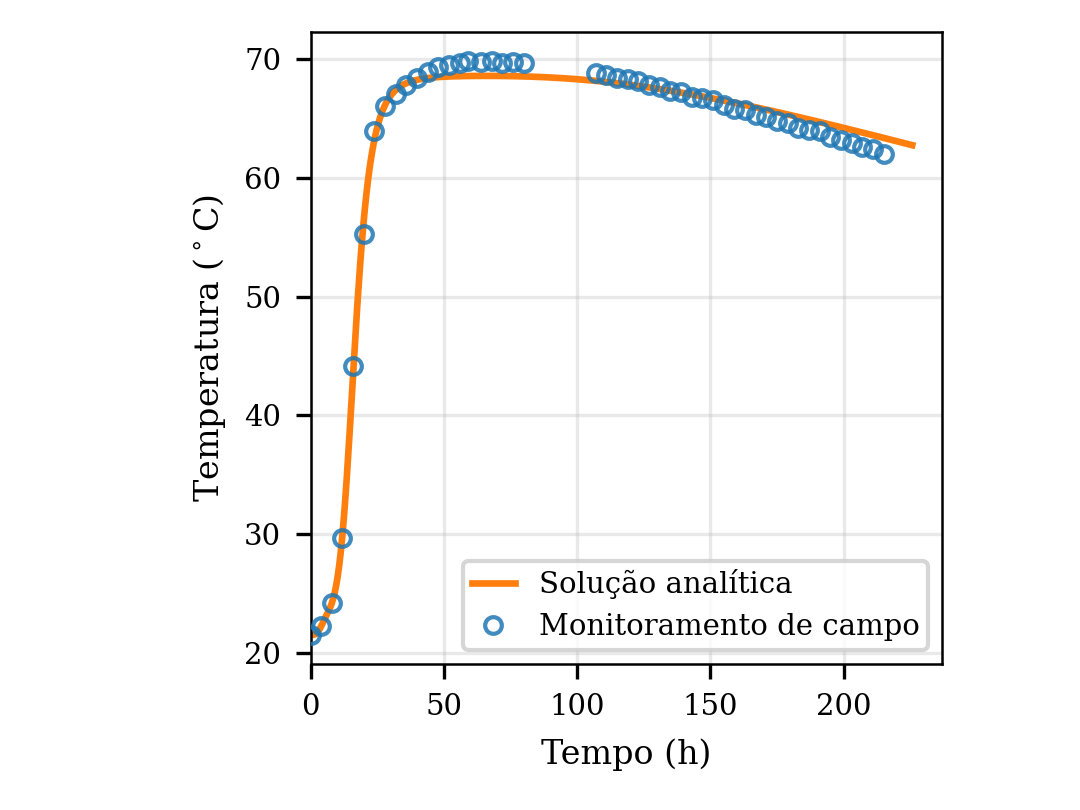
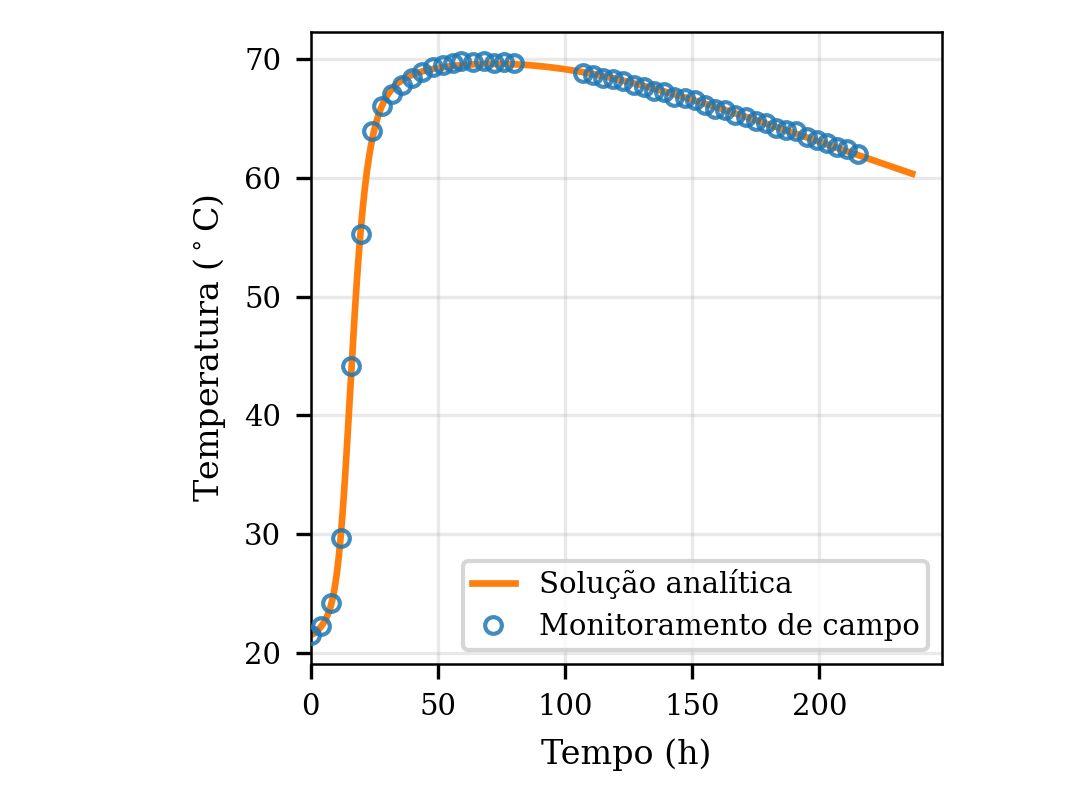
Back-analysis of the spillway monitoring, 21–25 September 2015 on the instrumented stretch. Pier P4 is the reference case. The other four piers use the same geometric idealisation.
Paper: Analytical and numerical validation of the thermochemical problem of early-age concrete · DOI 10.70271/rirc.v1n2a008
Input data
The member is read as an infinite slab: in a tall pier with sliding formwork, loss through the lateral faces dominates over the placement horizon. The effective thickness is the distance between those faces.
| Item | Value |
|---|---|
| Model | infinite slab, |
| Thermometer | |
| in the back-analysis | |
| Parametrisation | two-term Hill law for |
| adopted for P4 |
Placement of each pier:
| Pier | Placement | (°C) | (h) | Measured (°C) | |
|---|---|---|---|---|---|
| P1 | 2015-09-10 22:00 | 26.8 | 319 | 75 | 57.9 |
| P2 | 2015-09-11 06:00 | 22.9 | 311 | 73 | 71.5 |
| P3 | 2015-09-11 22:00 | 22.8 | 295 | 69 | 67.5 |
| P4 | 2015-09-15 06:00 | 21.5 | 215 | 49 | 69.8 |
| P5 | 2015-09-16 06:00 | 21.2 | 191 | 43 | 70.2 |
Mean ambient temperature in the placement table of the report lies between and . The P4 back-analysis uses .
Reference result — P4
Two scenarios for .
| Quantity | fixed at | free |
|---|---|---|
| (°C) | 44.73 | 41.56 |
| (h) | 16.68 | 16.66 |
| 5.50 | 5.53 | |
| (°C) | 2.36 | 7.19 |
| (h) | 5.00 | 15.65 |
| 3.37 | 1.64 | |
| () | 0.00450 | 0.00562 |
| RMSE (°C) | 0.76 | 0.27 |
Reference result — P1 to P5
Prescribed diffusivity , or free.
| Pier | RMSE, fixed (°C) | RMSE, free (°C) | free () | Measured (°C) |
|---|---|---|---|---|
| P1 | 1.11 | 0.71 | 0.01160 | 57.9 |
| P2 | 0.89 | 0.18 | 0.00698 | 71.5 |
| P3 | 1.95 | 1.66 | 0.00477 | 67.5 |
| P4 | 0.27 | 0.27 | 0.00571 | 69.8 |
| P5 | 0.56 | 0.54 | 0.00541 | 70.2 |
P2, P4 and P5 close with RMSE below when is free. P3 stays at . P1 measures and asks for nearly twice the typical . The report keeps P1 out of the global fit until the site record is confirmed.
Reducing P2–P5 to one isothermal curve, with held fixed, gives , , , , , , joint RMSE . The error profile versus is nearly flat: these histories do not separate the activation energy.
Series t × Tmax × teq × Q(t)
Tmax_C is the measured temperature. Because the back-analysis uses , teq_h . Q_kJ_kg converts the particular rise with , and . That conversion is not part of the fit. The fit works with the rise in °C. The column is there so the series has the same form as the other cases.
The particular generation in these files is the free- scenario of the processed monitoring file.
Report figures

P4, monitoring and analytical solution, fixed and free .