Legacy · Thermal validation
Cylindrical shaft
One isothermal calibration, three placement temperatures. What changes with is the time parameter of the particular curve and . The regressed amplitude stays at .
Paper: Analytical and numerical validation of the thermochemical problem of early-age concrete · DOI 10.70271/rirc.v1n2a008
Input data
| Item | Value |
|---|---|
| Radius | (FEM domain ) |
| point | axis |
| , one Hill term | , , |
| in the model | |
| , or | |
| on the cold faces | |
| Concrete | ; ; ; |
| Horizon | |
| in the column |
The report states the source as a rise , not as a cement content. Q_kJ_kg uses , the interconversion consumption, only to close the unit. A code that integrates in °C uses .
The analytical route regresses the particular curve with . The input is not recalibrated.
Reference result
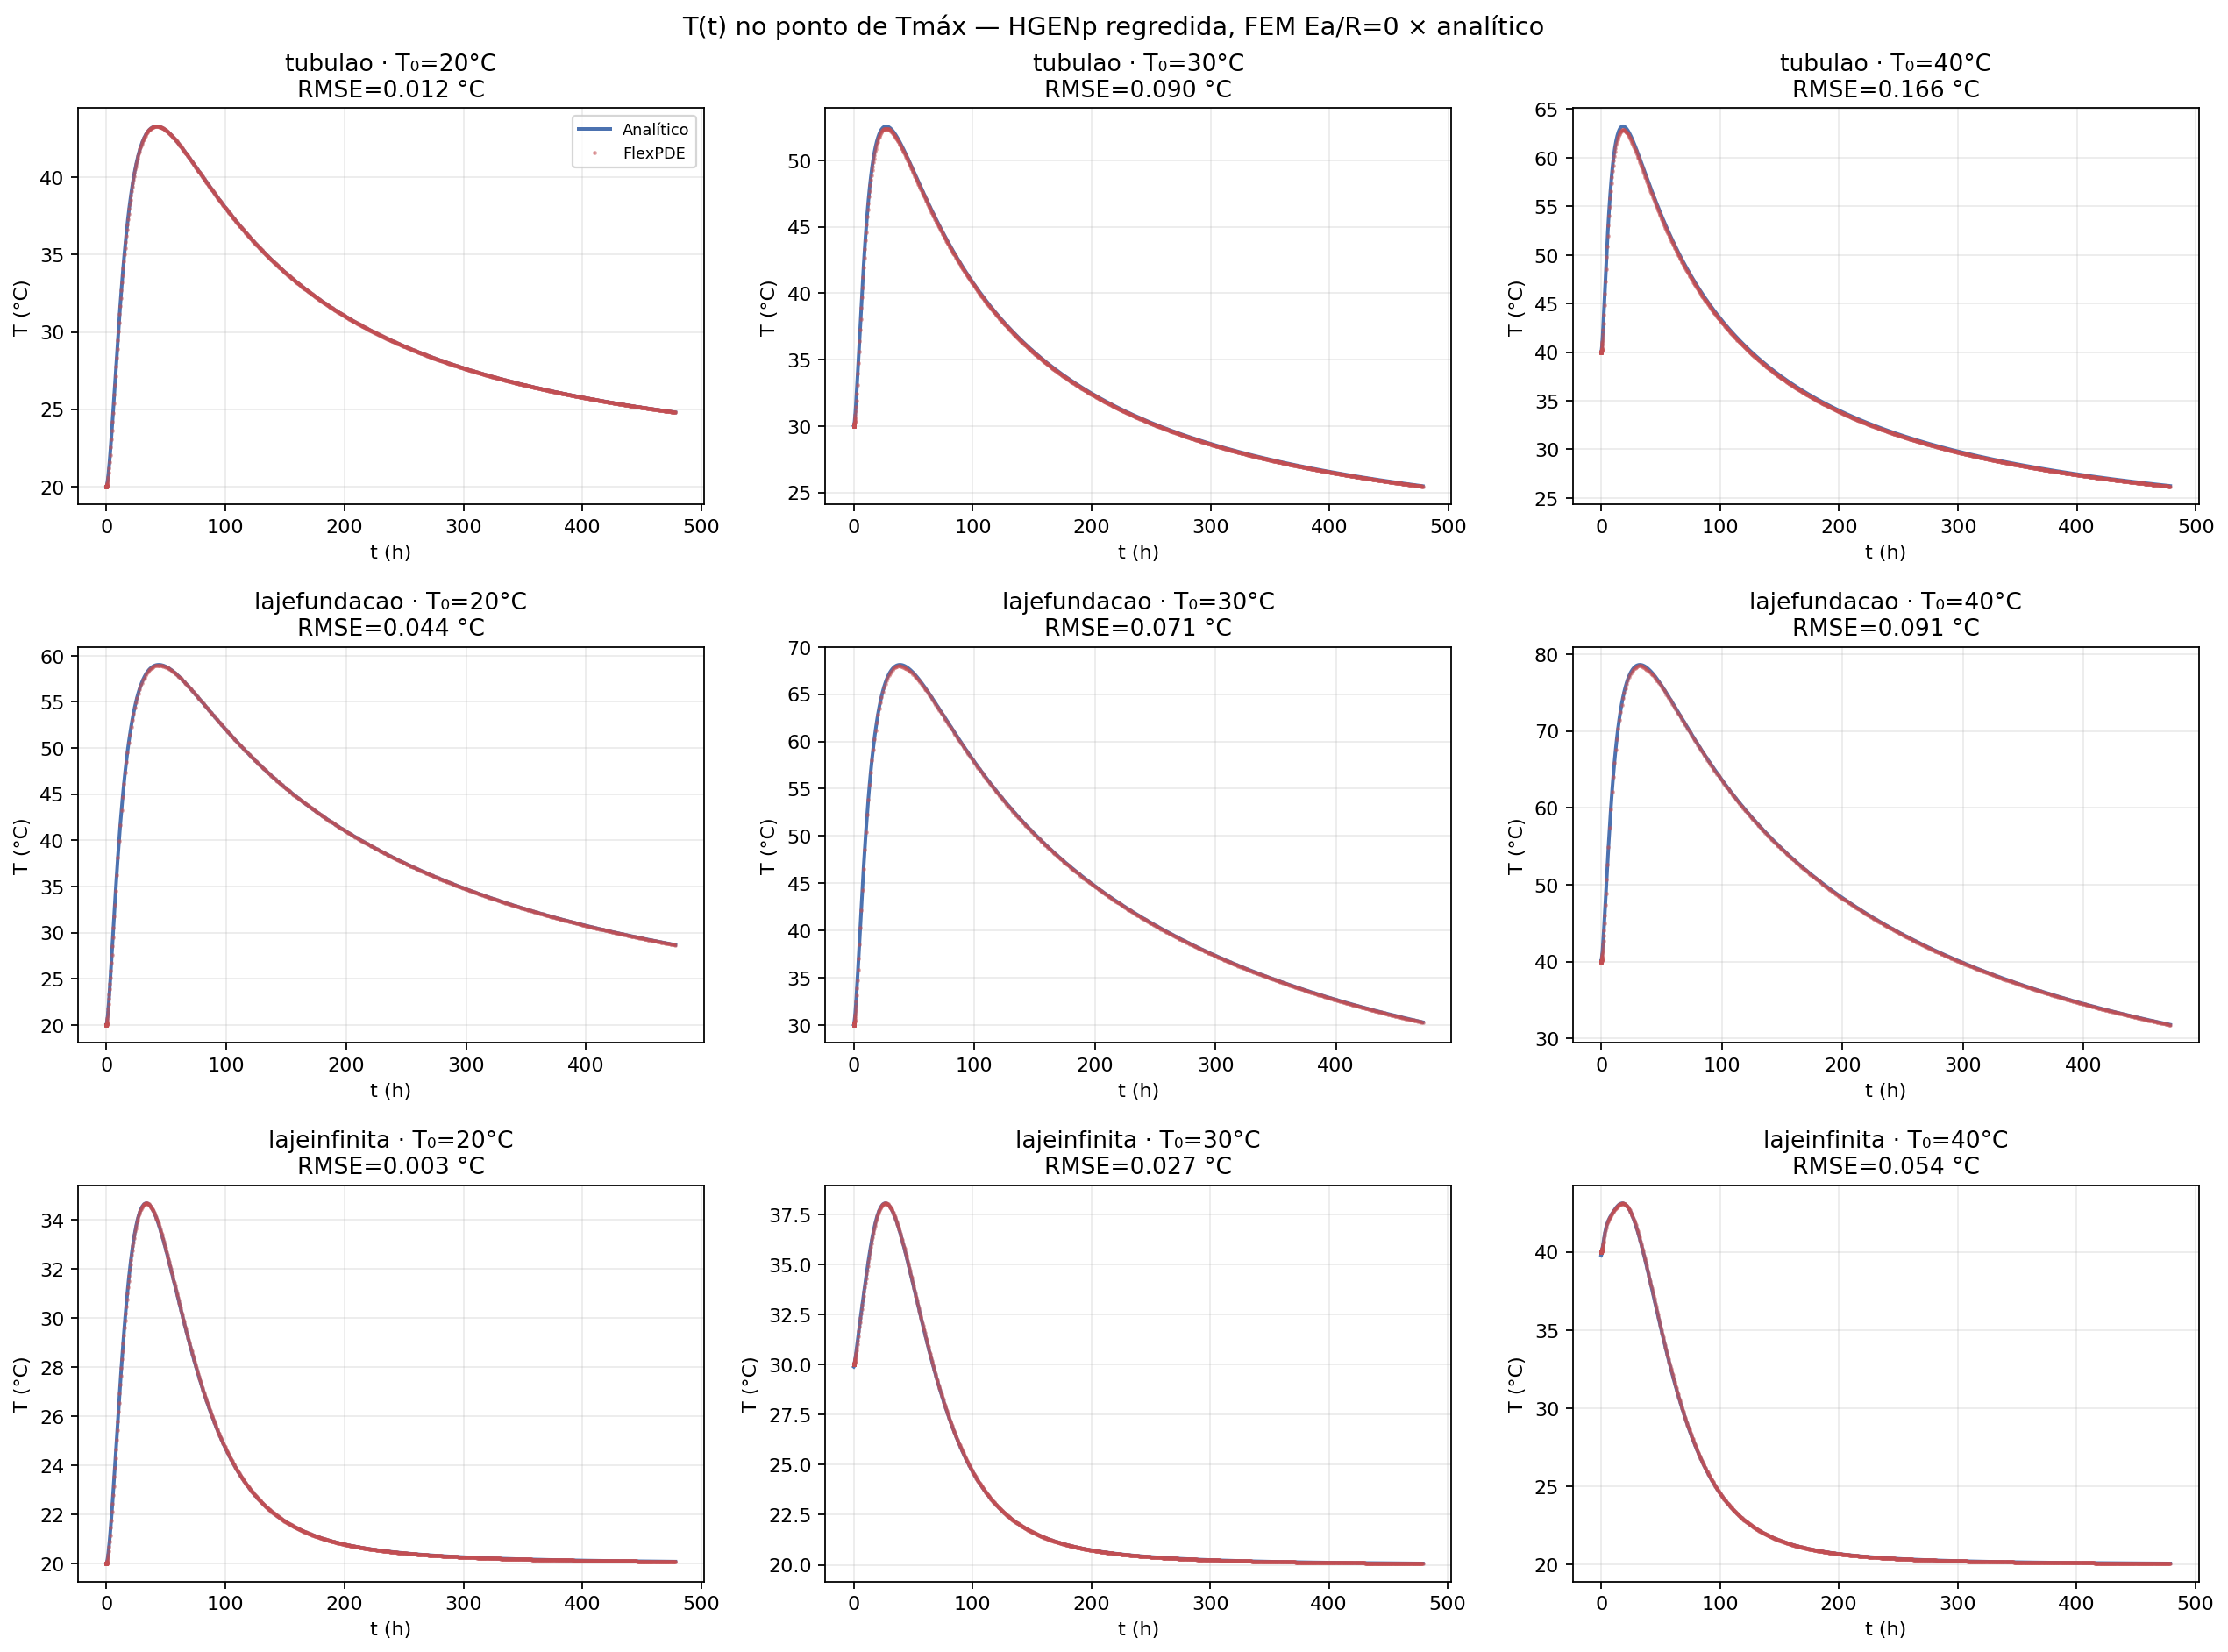
From the report. Regressed stays at (deviation under ). .
| (°C) | (h) | RMSE of (°C) | FEM / analytical (°C) |
|---|---|---|---|
| 20 | 23.63 | 0.012 | 43.3 / 43.3 |
| 30 | 15.38 | 0.090 | 52.4 / 52.6 |
| 40 | 10.35 | 0.166 | 62.8 / 63.2 |
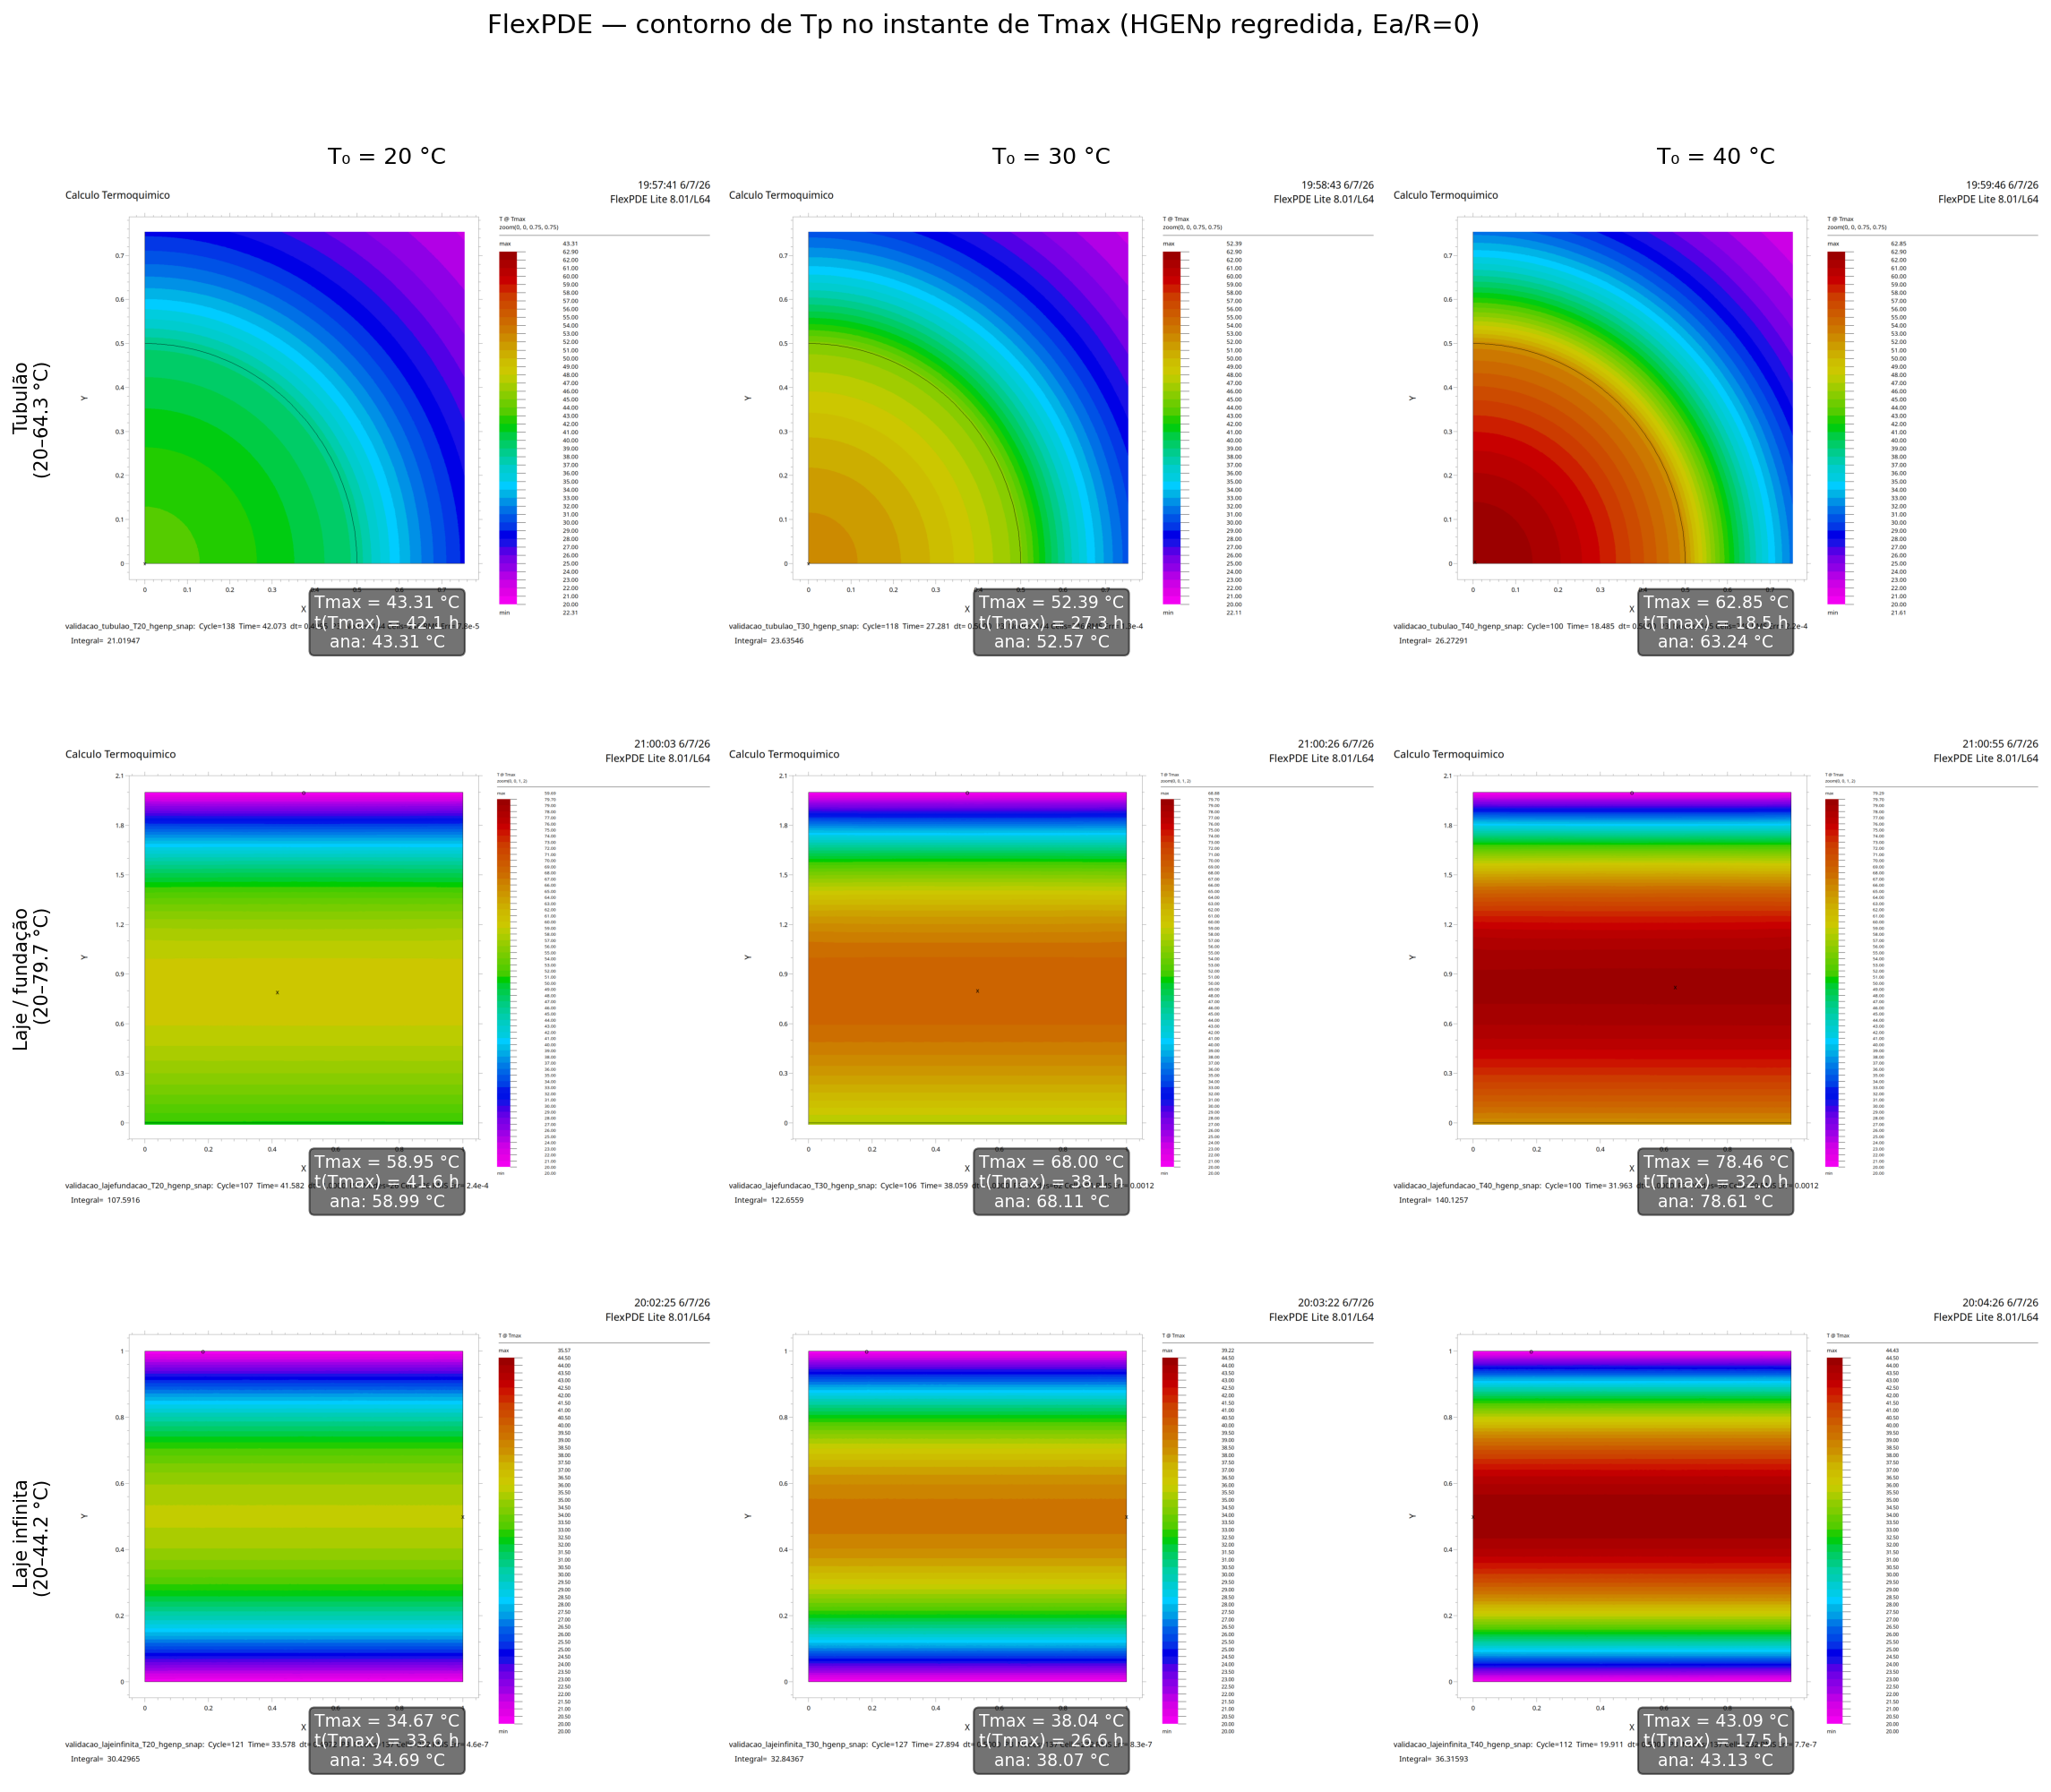
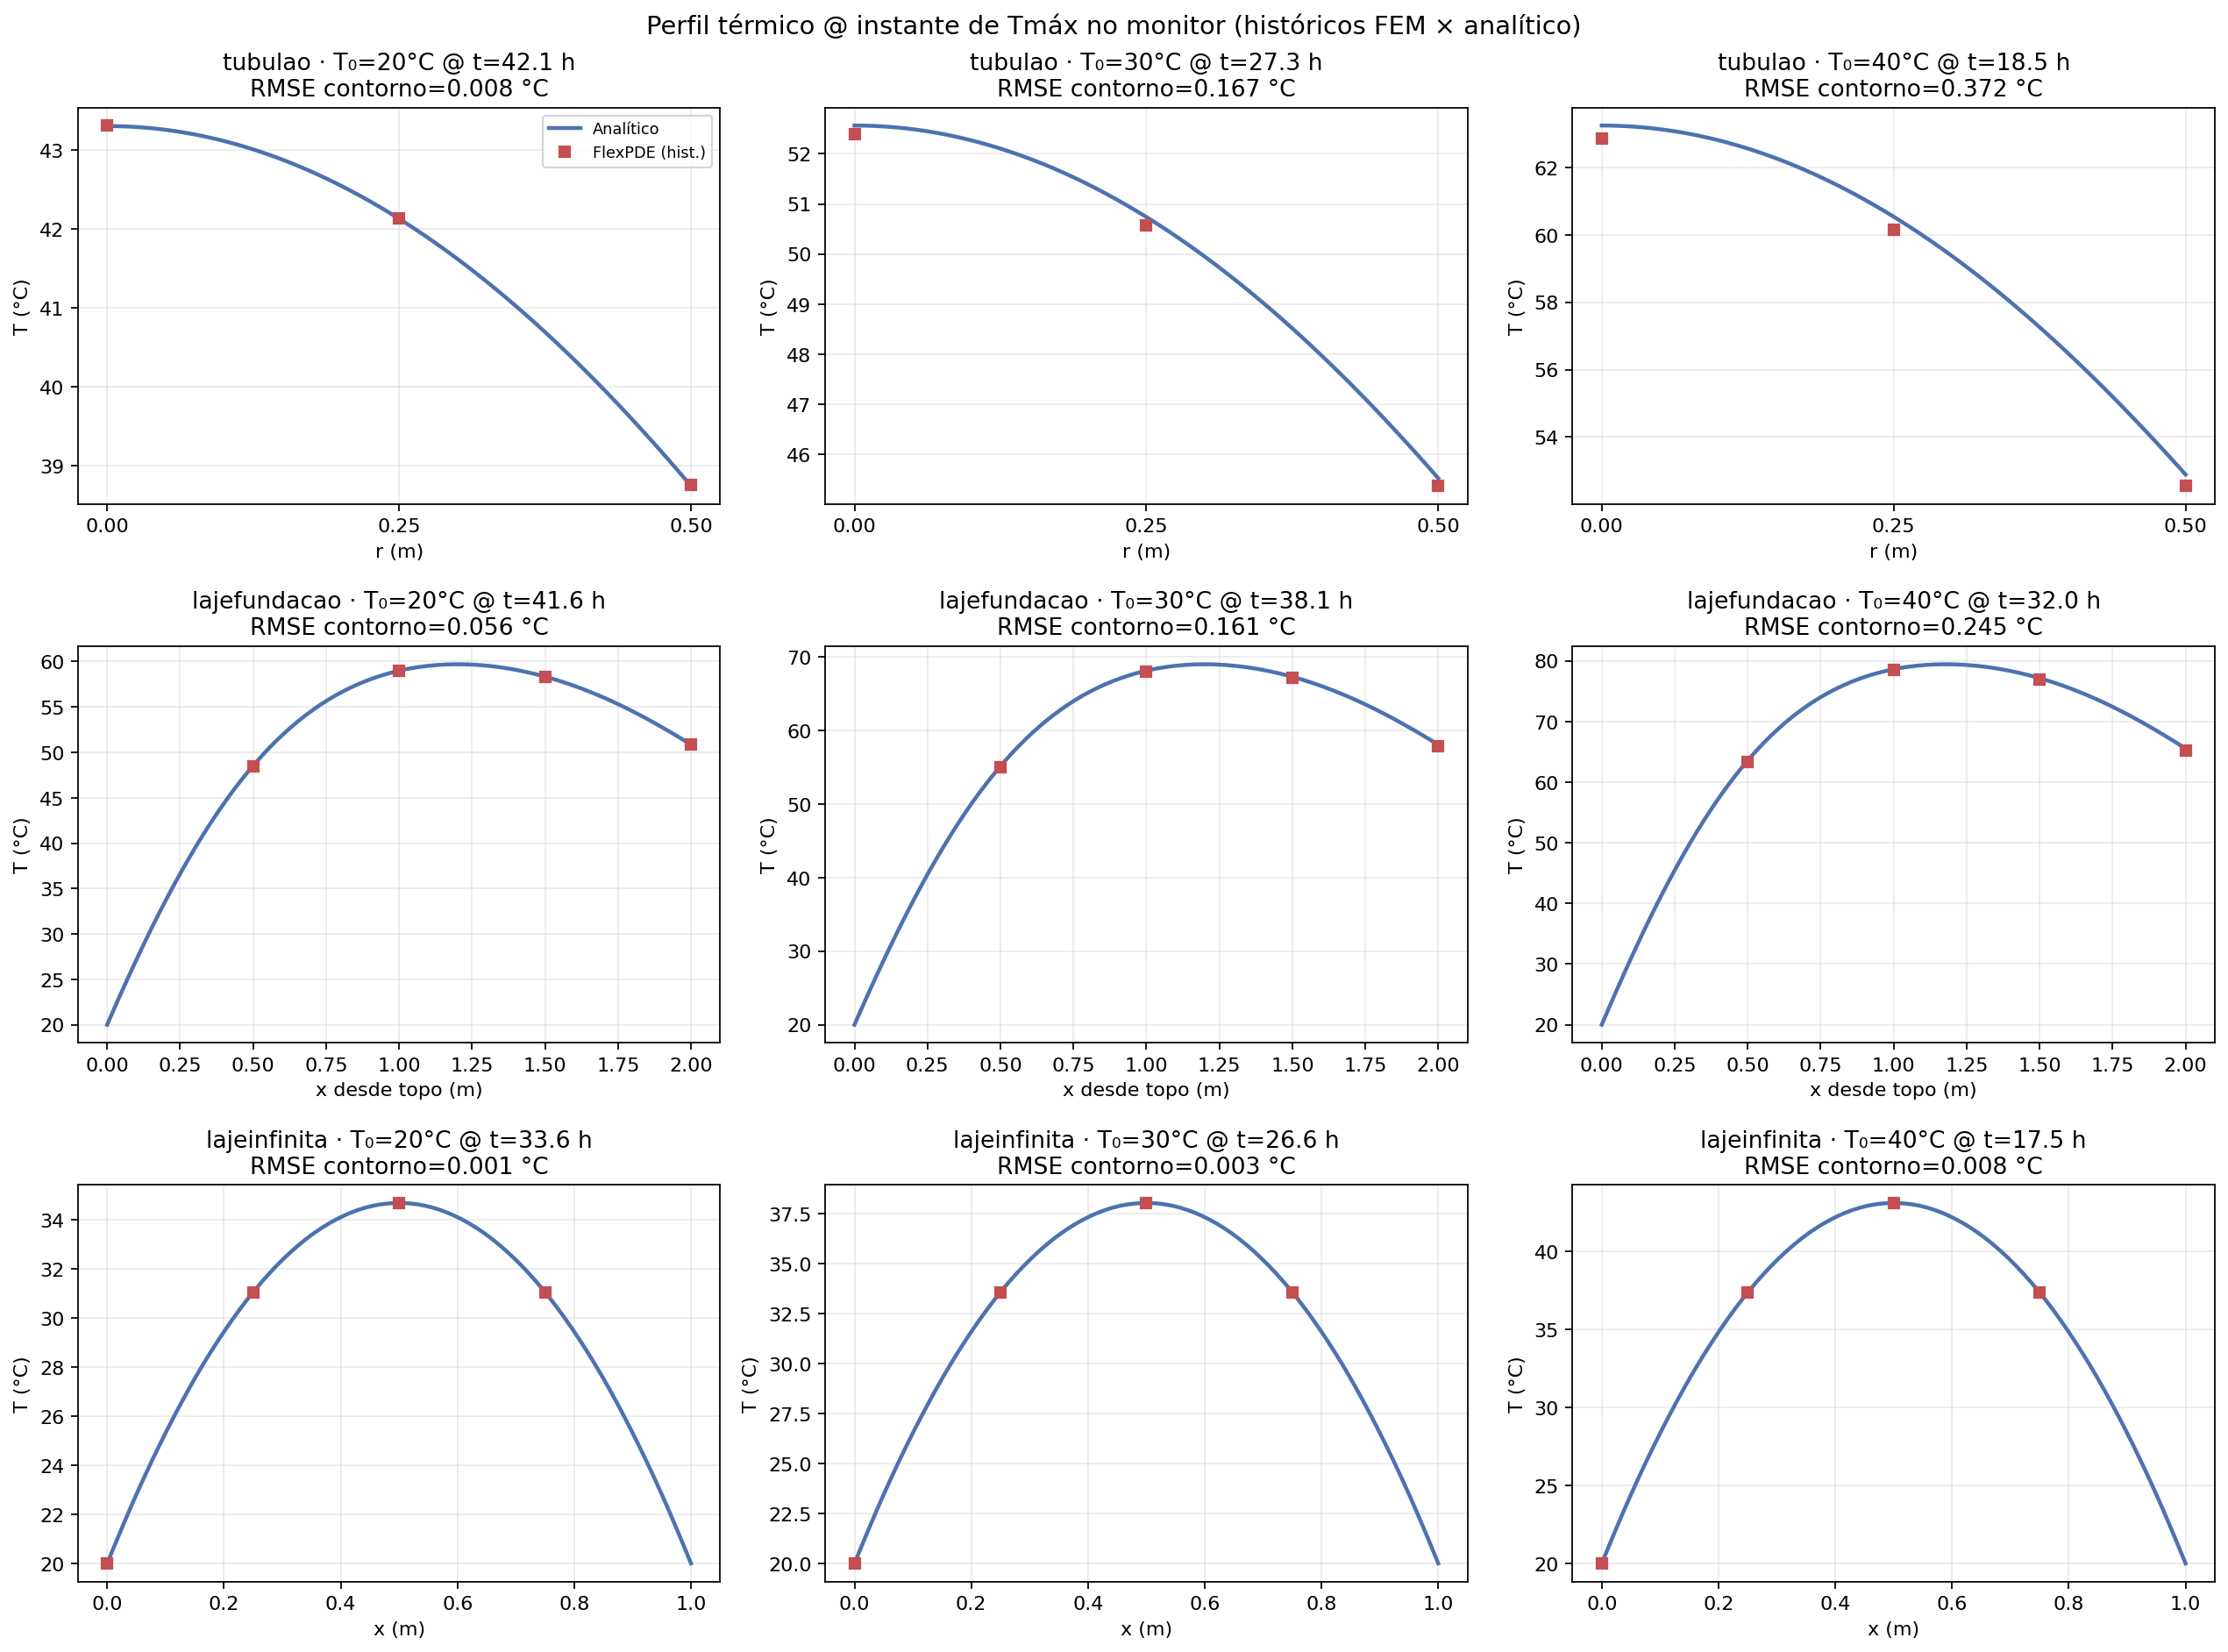
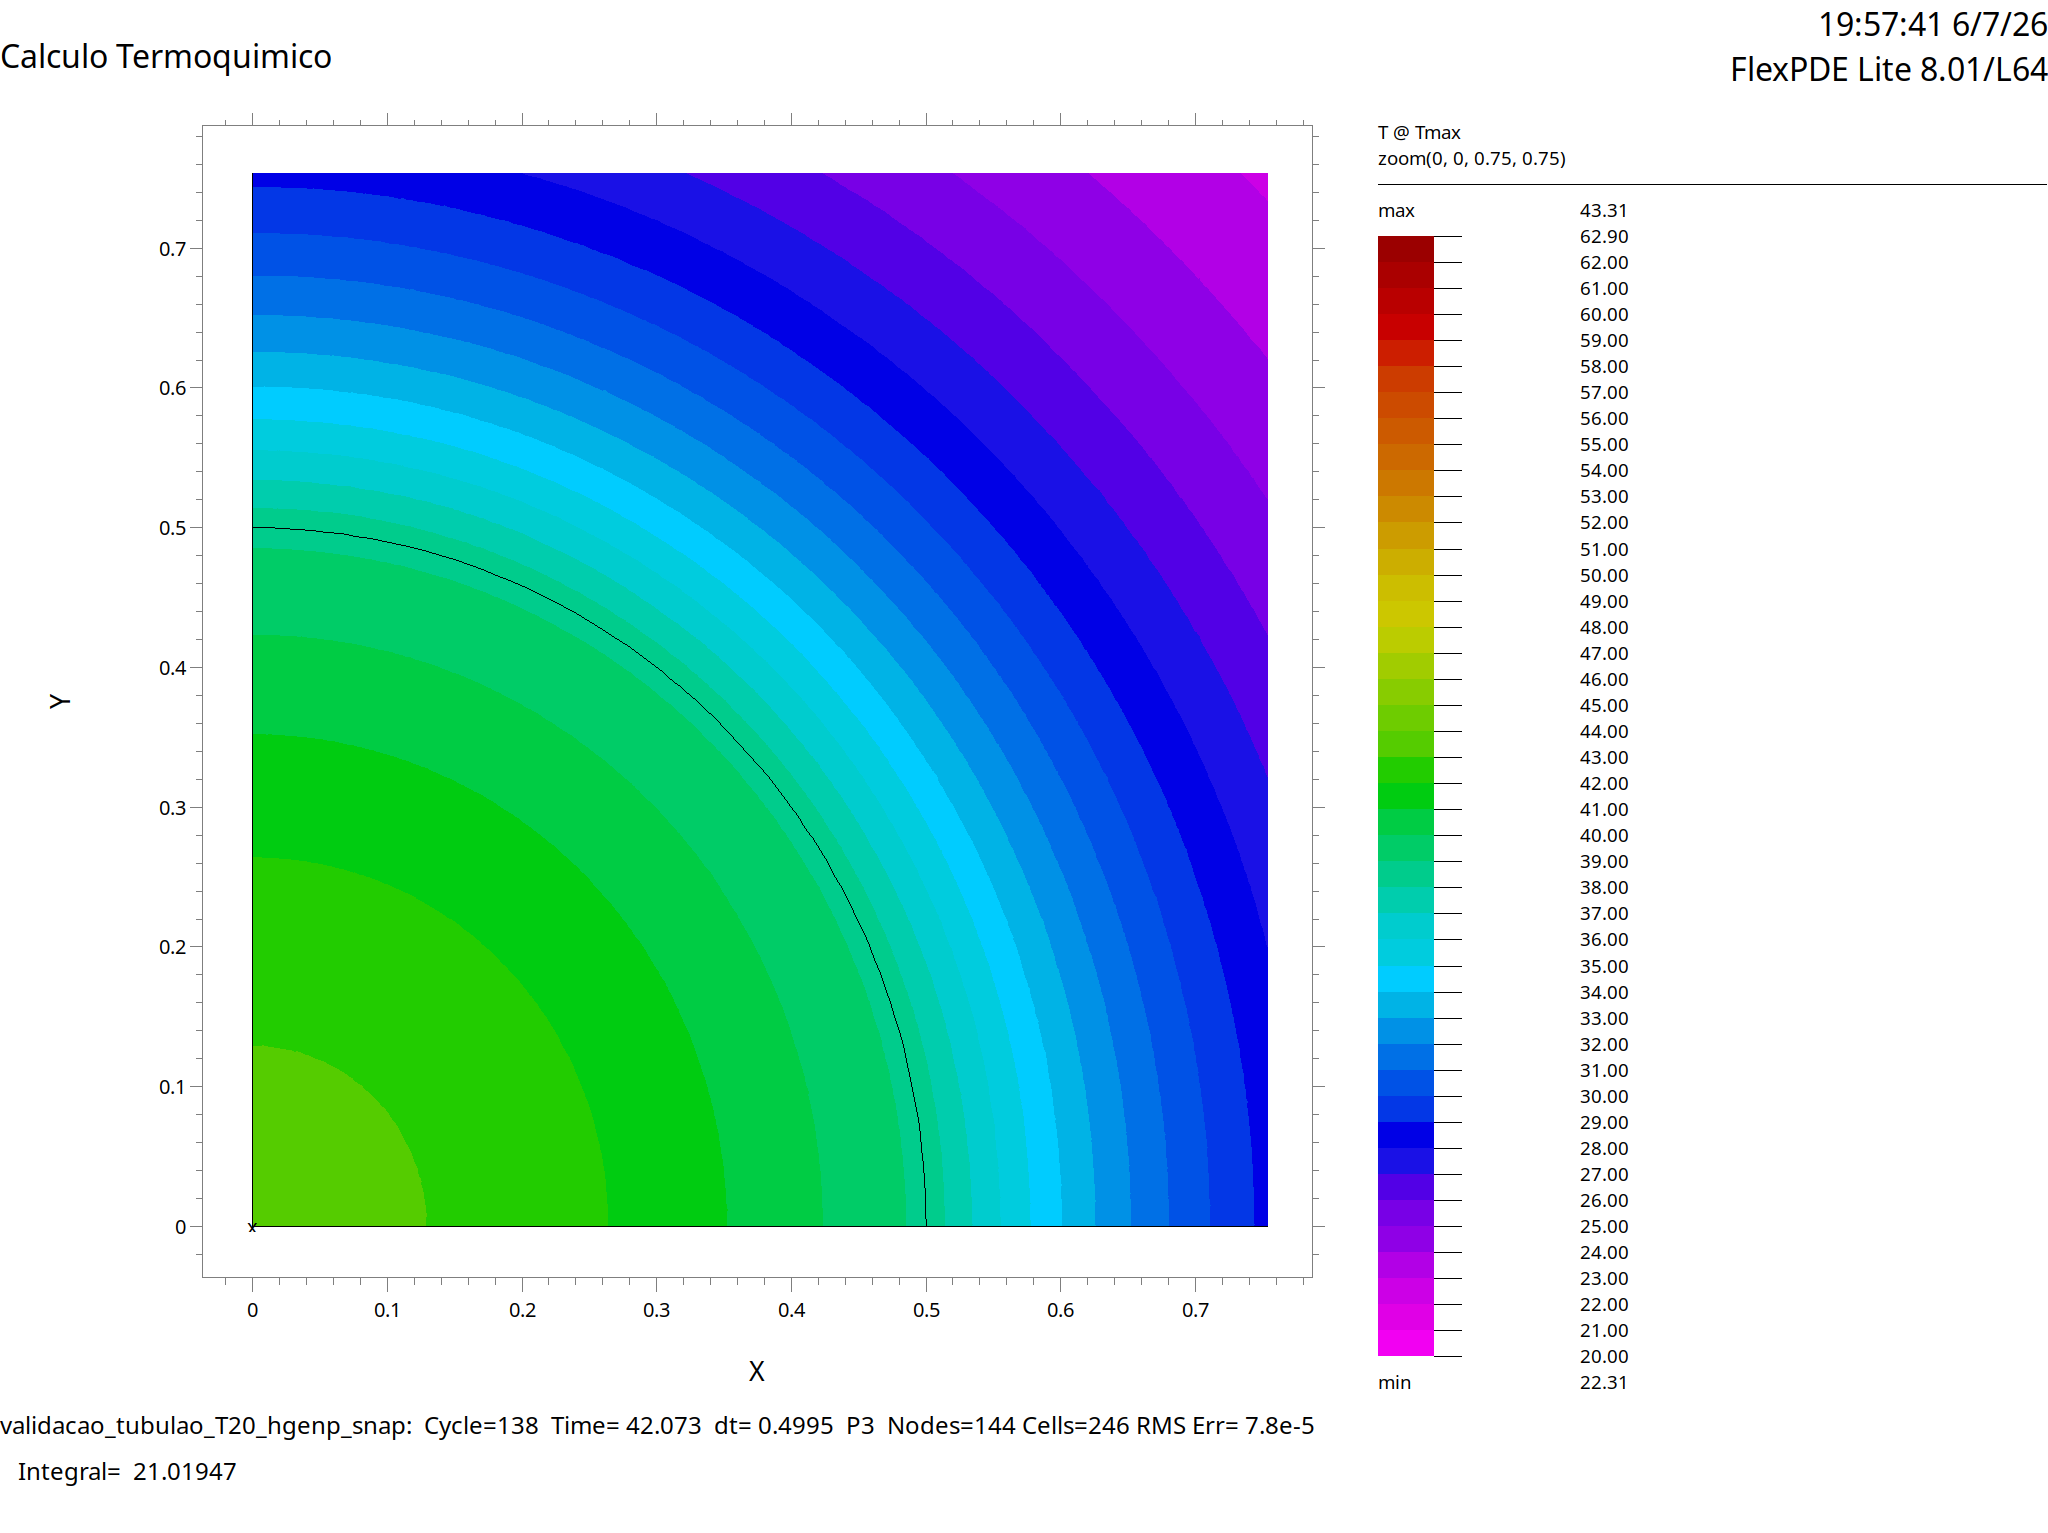
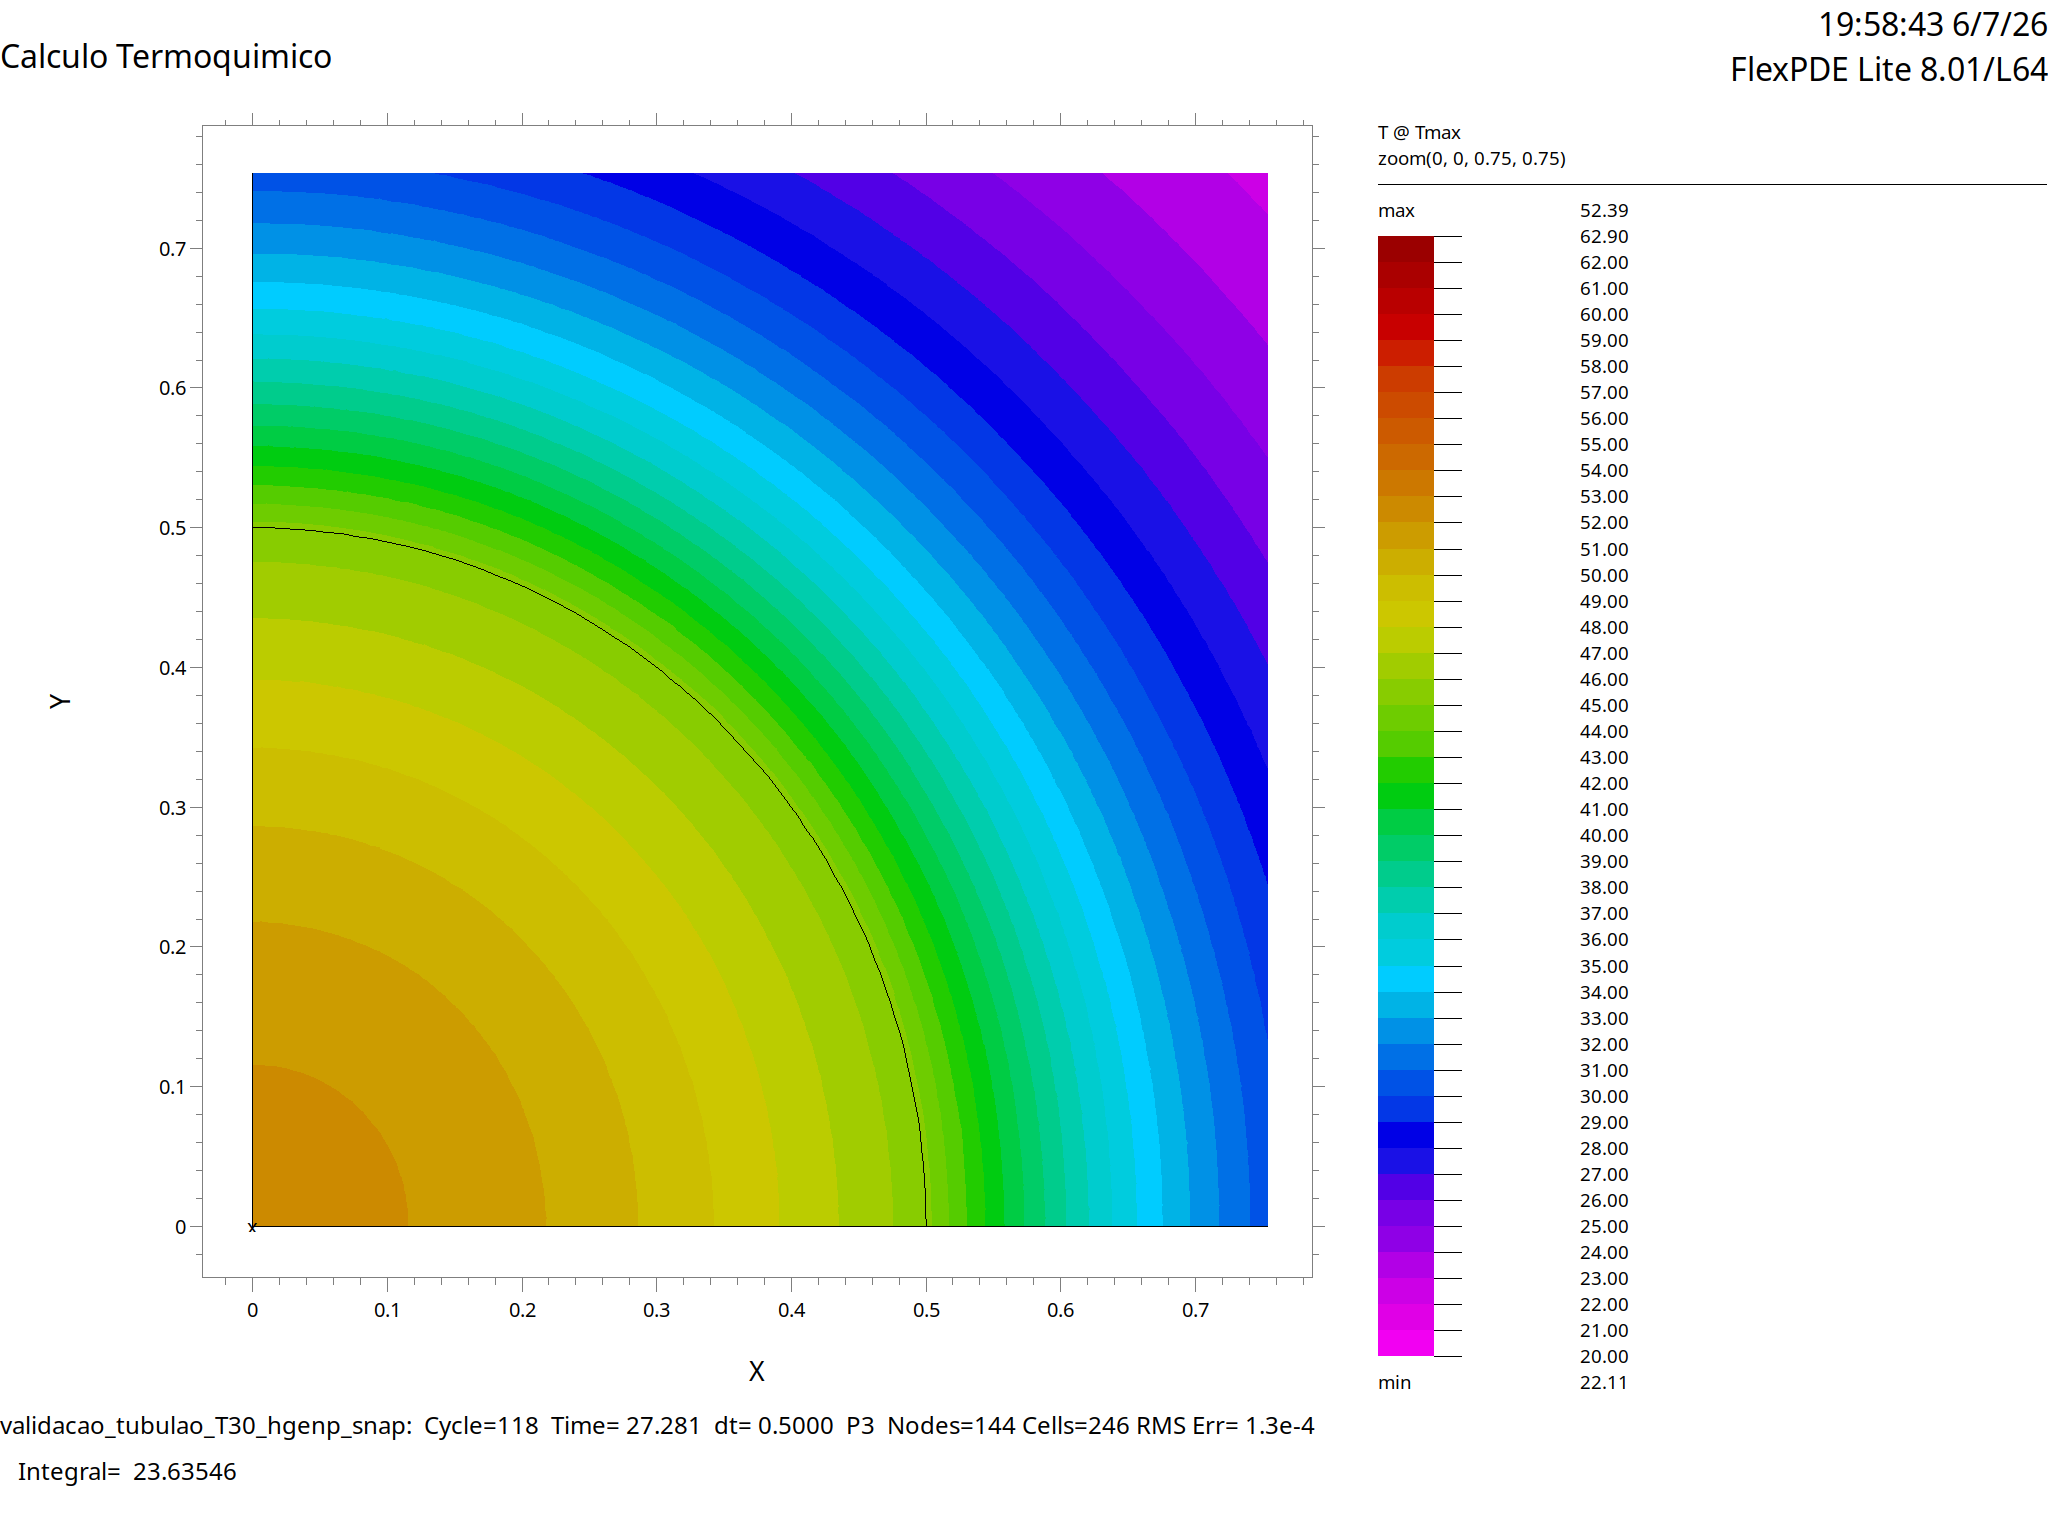
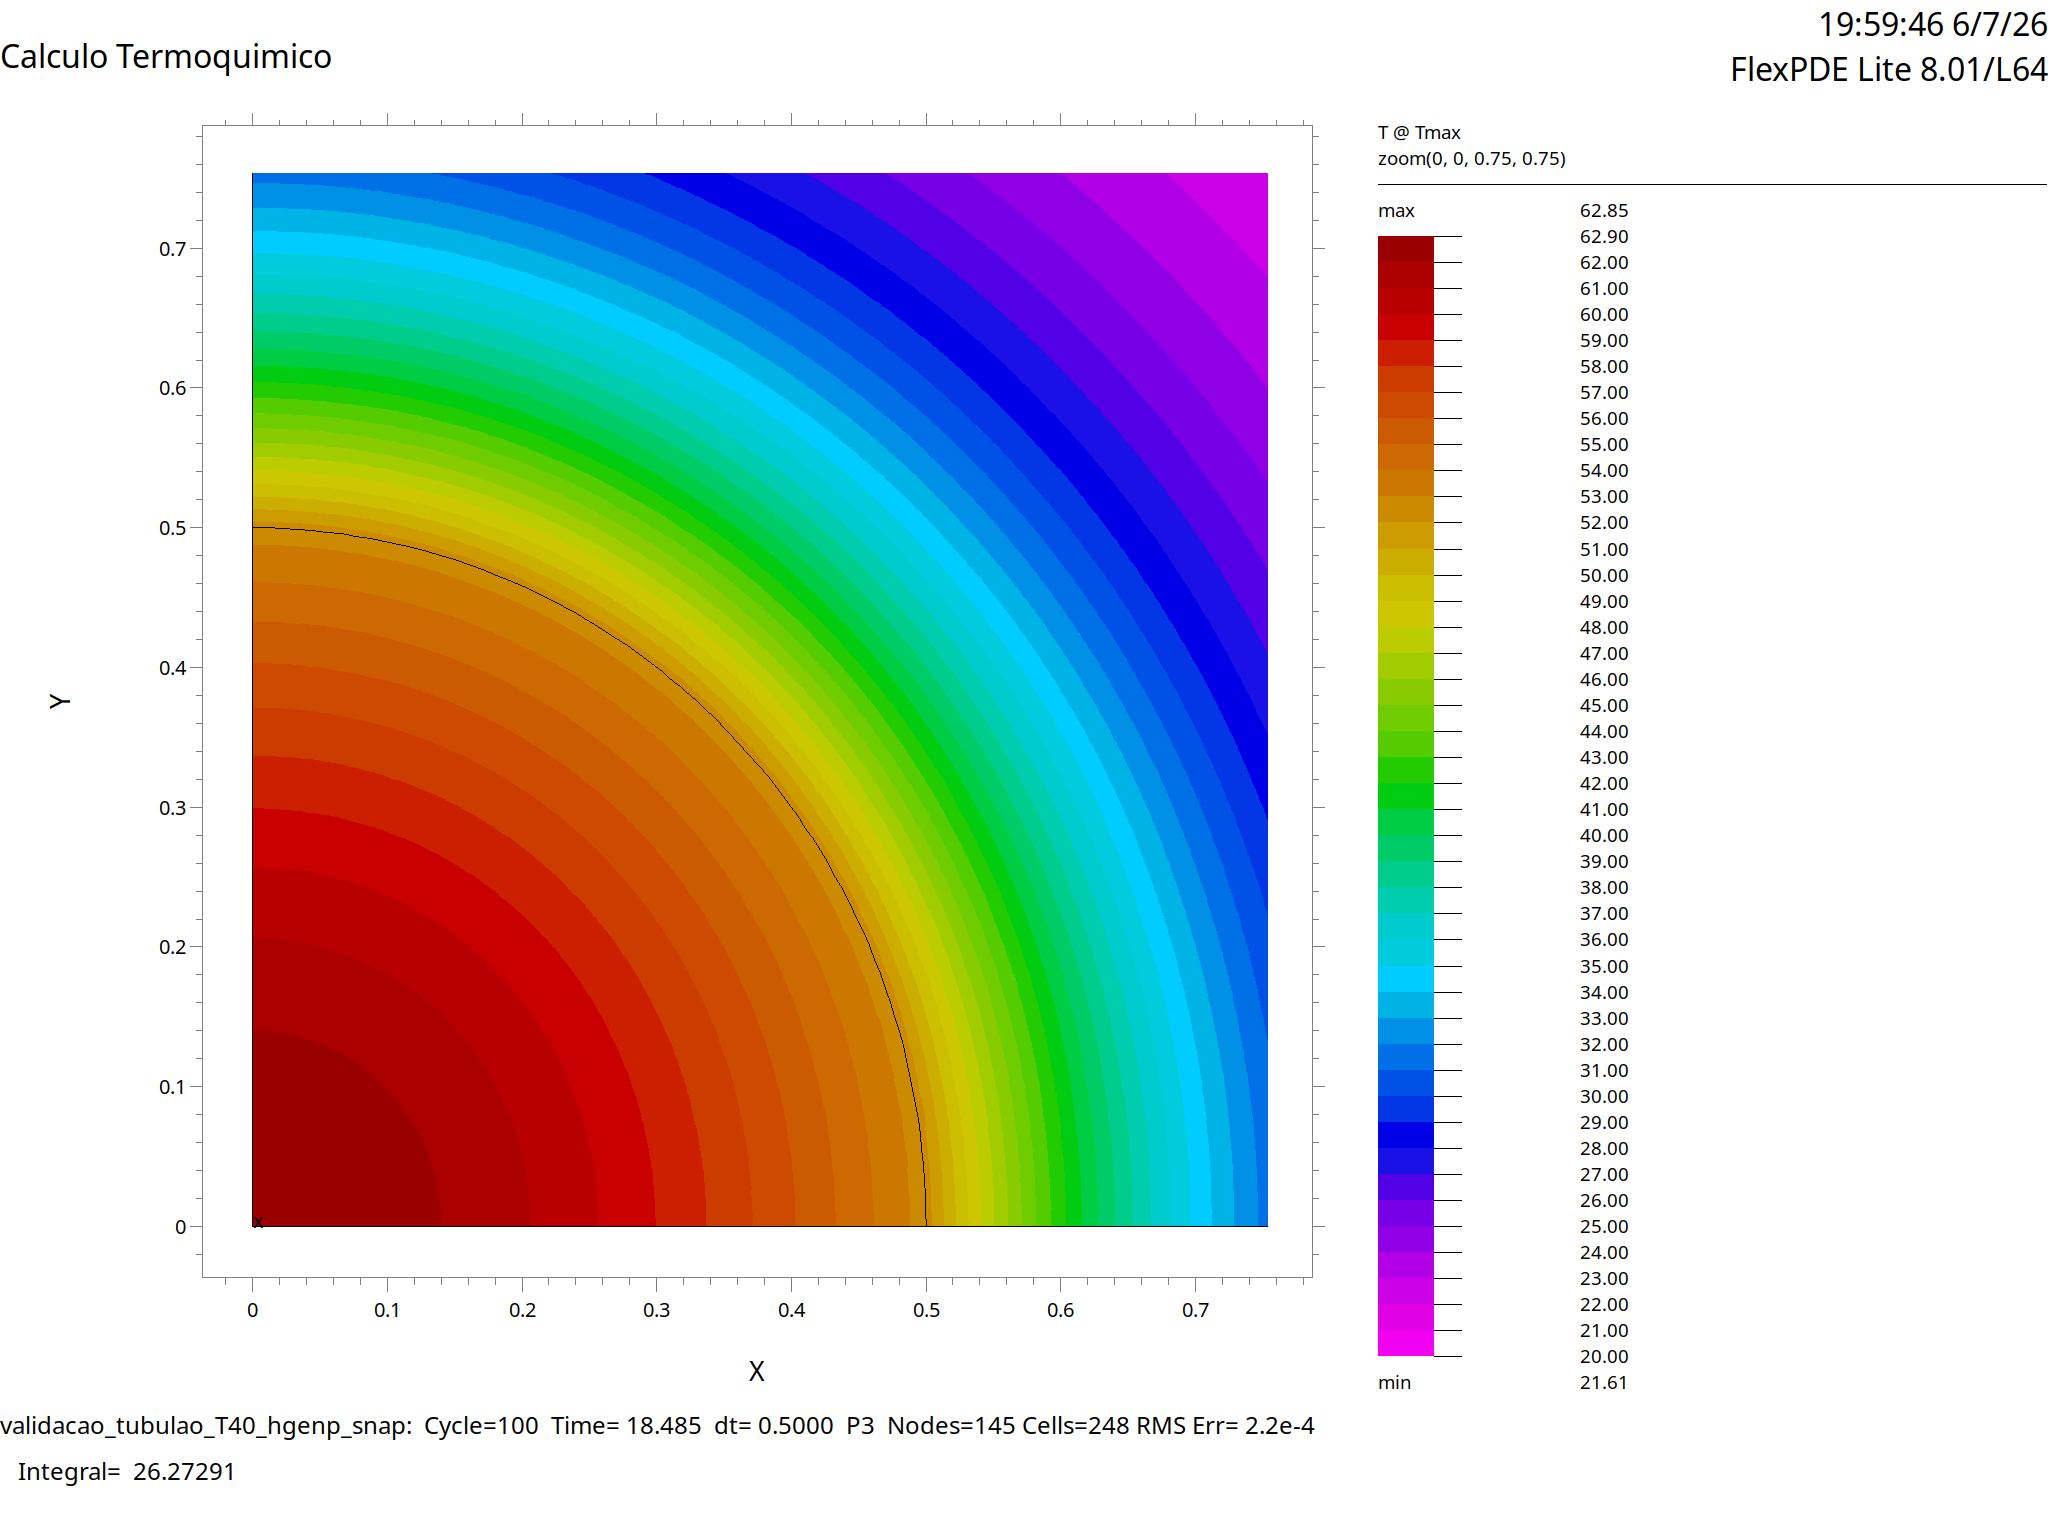
The largest error in the geometry × matrix is this shaft at . On the series of this page the FEM peaks are (), () and ().
The shaft FEM file did not store the generation column. In the particular series, Q_kJ_kg was rebuilt from the regressed Hill law (, , ) of each placement.
Series t × Tmax × teq × Q(t)
No suffix: Tmax_C is the FEM axis temperature, teq_h uses and , Q_kJ_kg is the isothermal calibration at that .
Suffix _particular: teq_h and Q_kJ_kg is the particular curve () used by the analytical solution.
Report figures